Magic powers at your fingertips—boosting your developer's mojo with gdb
Dawid Zalewski
14:00-15:30, Thursday, 18th April 2024
The first time you saw a program stopping at a breakpoint you set felt like magic. All this control you could exercise over your code without having to change or recompile it. Chances are that the thrill you experienced never returned. Breakpoints, perhaps a watch here and there, debugging doesn't seem so special anymore.
This interactive session, will rekindle your love for debugging and make you feel once again like a wizard. You'll (re-)discover how to effectively use break-, watch- and tracepoints. You'll set up exception traps and inspect and modify objects at runtime. You'll explore multiple execution paths by recording and reverting the state with checkpoints. Finally, you'll investigate the reasons for a segfault by going back in time step by step. All of this using the most popular C/C++ debugger,
gdb.
This session contains interactive elements. If you want to participate in activities you should bring a laptop running Linux with the gcc toolchain and gdb installed. Virtualized Linux under Windows WSL is fine. We'll use the terminal exclusively, don't forget to warm up your fingers!
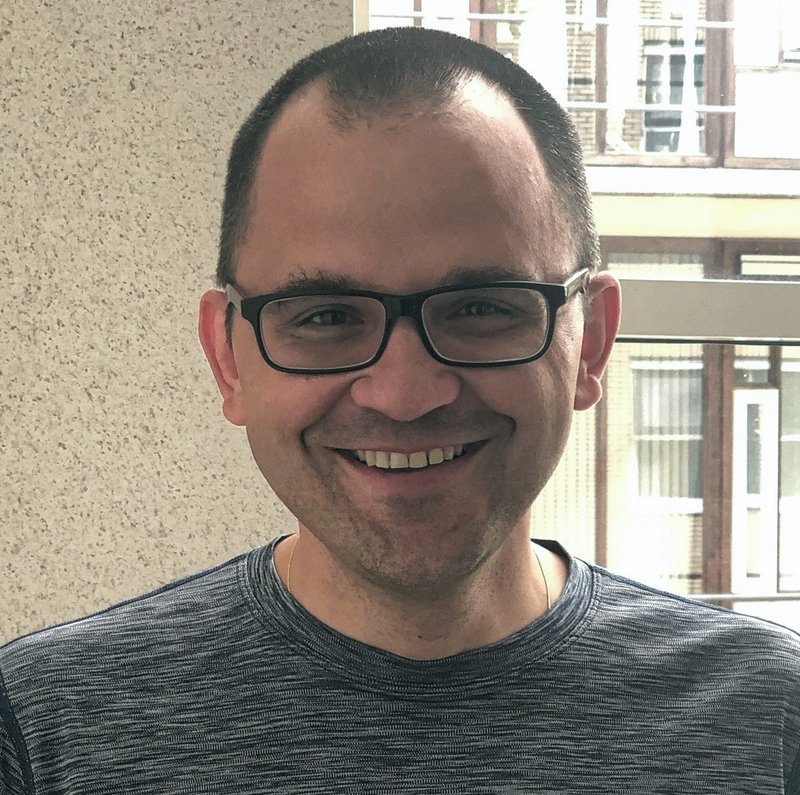
Dawid Zalewski

Dawid is a computer engineer and a passionate teacher with over 25 years of programming experience. He has co-evolved with various languages including Basic, Turbo Pascal and 8051 assembly to finally settle in the land of C++ (with occasional visits to Python, C# and a few others). He teaches at a university of applied sciences in the Netherlands, where he tries to convert new generations of programmers to use modern C++. His professional interests focus on the design and evolution of programming languages and paradigms. In his spare time he reads, hikes, cycles or writes code.